Copilot Analytics
The Copilot Analytics page shows how your team is using the AI Copilot inside the inbox — how often it's used, how fast and accurate it is, how satisfied agents are, and what it costs. It lives under Settings → AI Settings → Copilot Analytics (/settings/copilot-analytics).
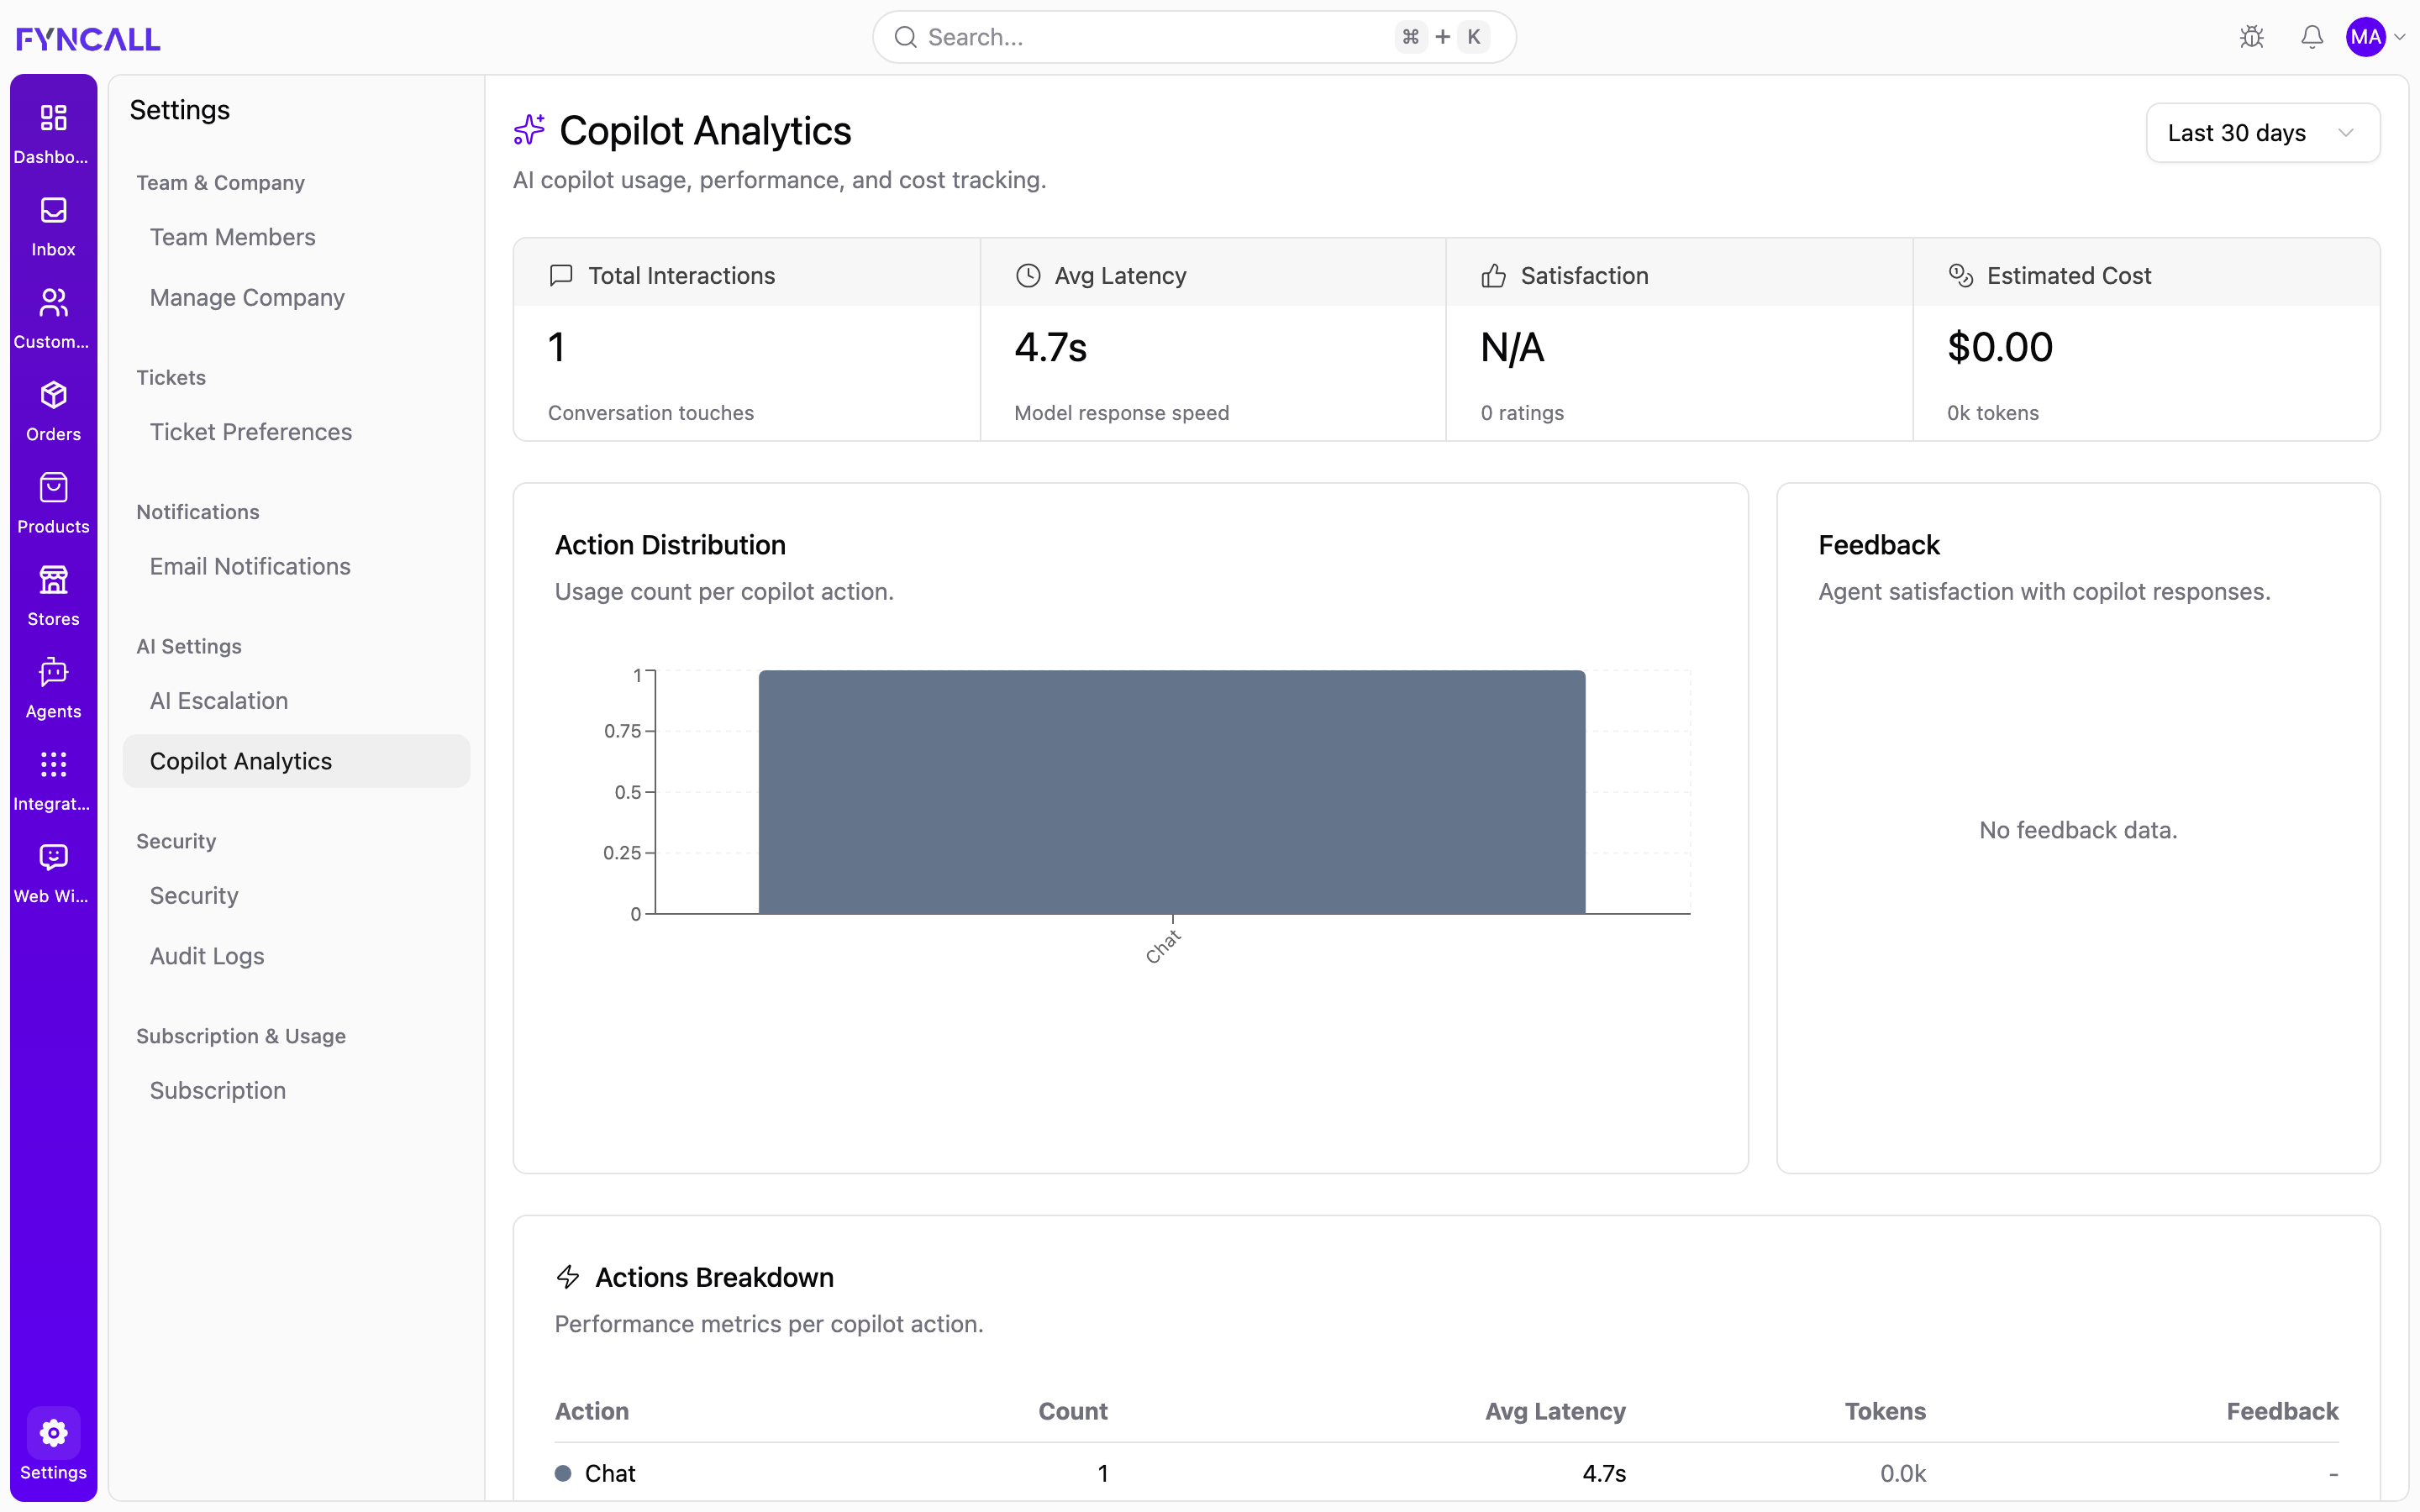
The page header reads Copilot Analytics with the subtitle "AI copilot usage, performance, and cost tracking."
This page requires admin (company management) access. Without it you'll see "You need admin access to view copilot analytics."
The Copilot is the AI assistant agents use while handling conversations — to summarize threads, draft replies, look up orders, analyze sentiment, and more. See Inbox → AI Copilot for how it's used day to day.
Date range
A dropdown in the top-right sets the reporting period for everything on the page: Last 7 days, Last 14 days, Last 30 days (default), Last 90 days, or Last year.
KPI cards
Four headline metrics across the top:
| Metric | What it shows |
|---|---|
| Total Interactions | Total conversation touches — how many times the Copilot was used in the period. |
| Avg Latency | Average model response speed, shown in seconds (or N/A if no data). |
| Satisfaction | The share of positive feedback as a percentage, with the total number of ratings below it. Shows N/A when there are no ratings. |
| Estimated Cost | Estimated spend in USD for the period, with total tokens used (in thousands) below. |
Action Distribution
A bar chart titled Action Distribution — "Usage count per copilot action." Each bar is a Copilot action (see the action reference below), color-coded and sized by how many times it was used. If there's nothing yet, it shows "No action data available."
Feedback
A donut chart titled Feedback — "Agent satisfaction with copilot responses." It splits agent ratings into Positive (green) and Negative (red), with counts shown beneath. Empty state: "No feedback data."
Actions Breakdown
A table titled Actions Breakdown — "Performance metrics per copilot action." One row per action with these columns:
| Column | What it shows |
|---|---|
| Action | The Copilot action (with its color dot). |
| Count | How many times it was used. |
| Avg Latency | Average response time in seconds (- if none). |
| Tokens | Total tokens used, in thousands (e.g. 12.3k). |
| Feedback | Positive (green +) and negative (red -) rating counts. |
Empty state: "No action data for this period."
Agent Adoption
A table titled Agent Adoption — "Copilot usage per team member." It shows how each agent is using the Copilot:
| Column | What it shows |
|---|---|
| Agent ID | The team member (shown as Agent #<id>). |
| Messages | Number of Copilot messages they sent. |
| Threads | Number of distinct Copilot conversations they started. |
| Actions Used | How many different actions they used. |
| Tokens | Total tokens consumed, in thousands. |
| Feedback | Their positive (+) and negative (-) ratings. |
Empty state: "No agent usage data for this period."
Most Popular Actions
A row of badges titled Most Popular Actions, listing the top actions with their usage counts (for example, Draft Reply: 42). This section is hidden when there's no data.
Copilot actions reference
The actions tracked across the charts and tables are:
| Action | Description |
|---|---|
| Summarize | Summarize a conversation. |
| Draft Reply | Draft a reply to the customer. |
| Draft Resolution | Draft a resolution for a ticket. |
| Customer 360 | Pull together a full view of the customer. |
| Search KB | Search the knowledge base. |
| Sentiment Analysis | Analyze customer sentiment. |
| Suggest Next Action | Suggest the next best step. |
| Similar Tickets | Find similar past tickets. |
| Lookup Orders | Look up the customer's orders. |
| Auto Triage | Automatically triage a conversation. |
| Review Reply | Review a drafted reply. |
| Chat | Free-form chat with the Copilot. |
If part of the data fails to load, the page shows "Some analytics data failed to load. Displaying available data." with a Retry option, and continues to display whatever loaded successfully.
Costs here count against your AI Credits — see the Subscription page to track and top up your balance.